Springboot添加jvm監控實現數據可視化
1.簡介
最近越發覺得,任何一個系統上線,運維監控都太重要了。本文介紹Prometheus + Grafana的方法監控Springboot 2.X,實現美觀漂亮的數據可視化。
2.添加監控
Spring-boot-actuator module 可幫助您在將應用程序投入生產時監視和管理應用程序。您可以選擇使用 HTTP 端點或 JMX 來管理和監控您的應用程序。Auditing, health, and metrics gathering 也可以自動應用于您的應用程序。引入依賴如下:
<!--監控報警--><dependency><groupId>org.springframework.boot</groupId><artifactId>spring-boot-starter-actuator</artifactId></dependency><dependency><groupId>io.micrometer</groupId><artifactId>micrometer-registry-prometheus</artifactId></dependency>
對于Springboot,要開啟Actuator,并打開對應的Endpoint:
#prometheus配置info:alen:alenmanagement:endpoints:web:base-path:/actuatorexposure:include:'*'
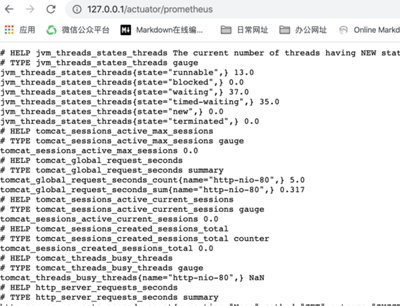
啟動Springboot后,可以通過下面URL看能不能正確獲取到監控數據:localhost/actuator/prometheus 獲取數據成功,說明Springboot能正常提供監控數據。
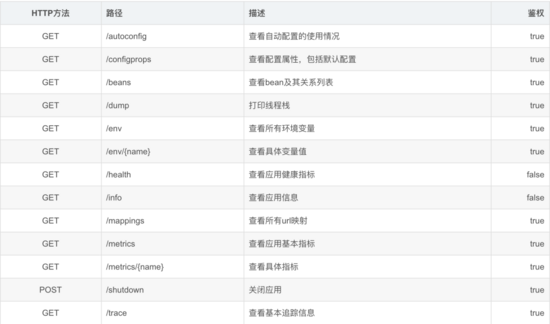
主要的端點
3.配置Prometheus
Prometheus 是 Cloud Native Computing Foundation 項目之一,是一個系統和服務監控系統。它按給定的時間間隔從配置的目標收集指標,評估規則表達式,顯示結果,并且如果觀察到某些條件為真,則可觸發警報。
特性
• 多維度 數據模型(由度量名稱和鍵/值維度集定義的時間序列)• 靈活的查詢語言 來利用這種維度• 不依賴分布式存儲;單個服務器節點是自治的 • 時間序列采集通過HTTP上的 pull model 發生• 推送時間序列 通過中間網關得到支持• 通過 服務發現 或 靜態配置 來發現目標• 多種模式的 圖形和儀表盤支持• 支持分級和水平 federation
通過 Prometheus 來抓取數據 Prometheus 會按照配置的時間周期去 pull 暴露的端點(/actuator/prometheus)中的指標數據 prometheus.yml 配置
- job_name: ’actuator-ruoyi’ # metrics_path defaults to ’/metrics’ # scheme defaults to ’http’. metrics_path: ’/actuator/prometheus’ static_configs: - targets: [’10.42.95.4’]
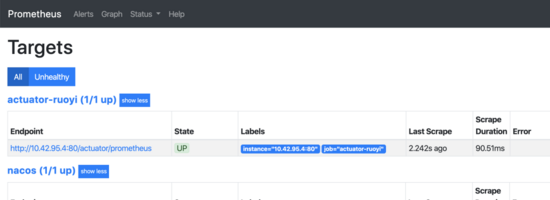
重然后再啟動prometheus,訪問prometheus網址,查看targets啟動是否正常如下圖
4.Grafana添加監控模版
默認啟動后Grafana地址為:http://localhost:3000/,登錄用戶名和密碼是admin/admin,import配置grafana id = 4701

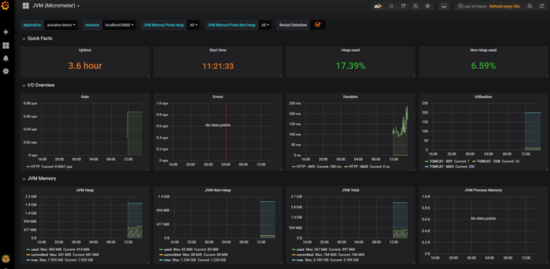
最終的效果是這樣子的,如下圖
5.備注
問題:添加上訪問不了Endpoint?解決方案:原因是項目用的shiro,需要添加過濾
filterChainDefinitionMap.put('/actuator/**','anon');
問題二:
/O exception (java.io.IOException) caught when processing request to {}->unix://localhost:80: Broken pipe
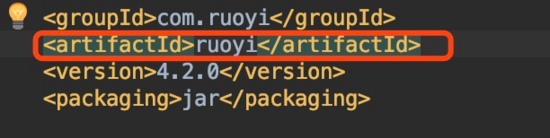
解決方法:導致這個錯誤的原因是 project.artifactId 可能包含了大寫。改成小寫就行
到此這篇關于Springboot添加jvm監控實現數據可視化的文章就介紹到這了,更多相關Springboot jvm監控數據可視化內容請搜索好吧啦網以前的文章或繼續瀏覽下面的相關文章希望大家以后多多支持好吧啦網!
相關文章:

 網公網安備
網公網安備