python實現3D地圖可視化
基于python代碼的3D地圖可視化,供大家參考,具體內容如下
介紹
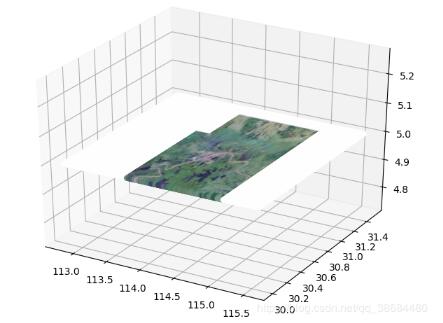
使用Python對地圖進行3D可視化。以地圖為地圖,可以在三維空間對軌跡、點進行可視化。
庫
我們使用了多個庫:
1.gdal;主要是用于讀取地圖信息,這個庫在GIS中很常用,使用C++代碼編寫的,如果安裝不了需要在pypi里面找一下對應的資源。
2.opencv;很常用的圖像處理庫。
3.matplotlib;常用的可視化庫
結果
廢話不多說直接上結果:

代碼
直接上代碼,代碼很簡單。
from osgeo import gdalimport cv2gdal.UseExceptions()ds = gdal.Open(’E:/Pythoncode/讀取地理信息/無標題.tif’)bandg = ds.GetRasterBand(1)elevationg = bandg.ReadAsArray()bandr = ds.GetRasterBand(2)elevationr = bandr.ReadAsArray()bandb = ds.GetRasterBand(3)elevationb = bandb.ReadAsArray()import matplotlib.pyplot as pltnrows, ncols = elevationr.shapeelevation= cv2.merge([elevationg,elevationr,elevationb])## I’m making the assumption that the image isn’t rotated/skewed/etc. # This is not the correct method in general, but let’s ignore that for now# If dxdy or dydx aren’t 0, then this will be incorrectx0, dx, dxdy, y0, dydx, dy = ds.GetGeoTransform()x1 = x0 + dx * ncolsy1 = y0 + dy * nrowsplt.imshow(elevation, cmap=’gist_earth’, extent=[x0, x1, y1, y0])plt.show()from PIL import Imagefrom mpl_toolkits.mplot3d import Axes3Dimport matplotlib.pyplot as pltfig = plt.figure()ax = Axes3D(fig)img = Image.open(’E:/Pythoncode/讀取地理信息/無標題.tif’)xx=[]yy=[]colall=[]x = img.size[0]y = img.size[1]for i in range(x): for j in range(y): r = hex(img.getpixel((i, j))[0])[2:] b = hex(img.getpixel((i, j))[1])[2:] g = hex(img.getpixel((i, j))[2])[2:] if len(r) == 1: r = ’0’ + r if len(b) == 1: b = ’0’ + b if len(g) == 1: g = ’0’ + g col = ’#’ + r + b + g colall.append(col) xx.append(x0 + dx * i) yy.append(y0 + dy * j) # col = ’#FF00FF’ax.scatter(xx, yy, 5, c=colall, alpha=0.5)plt.show()
以上就是本文的全部內容,希望對大家的學習有所幫助,也希望大家多多支持好吧啦網。
相關文章:

 網公網安備
網公網安備