python matplotlib實現(xiàn)將圖例放在圖外
關(guān)于matplotlib如何設(shè)置圖例的位置?如何將圖例放在圖外?以及如何在一幅圖有多個子圖的情況下,刪除重復(fù)的圖例?我用一個簡單的例子說明一下。
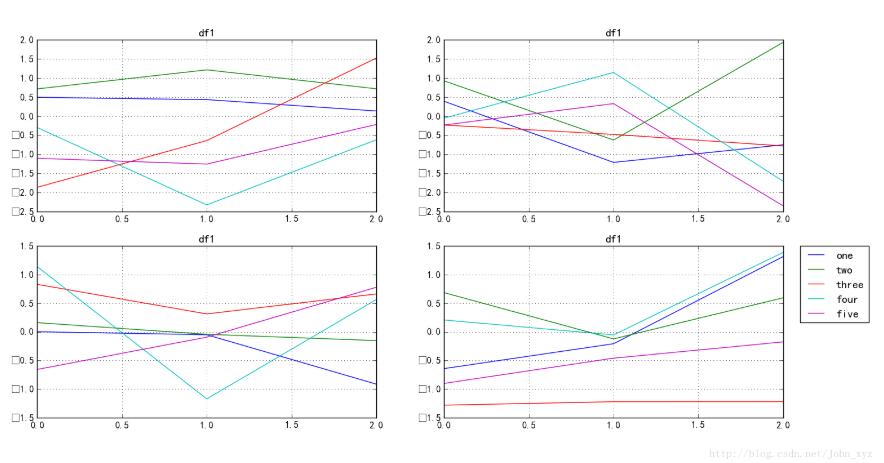
import pandas as pdimport numpy as npimport matplotlib.pyplot as pltfig = plt.figure(1)ax1 = fig.add_subplot(2,2,1)ax2 = fig.add_subplot(2,2,2)ax3 = fig.add_subplot(2,2,3)ax4 = fig.add_subplot(2,2,4)df1 = pd.DataFrame(np.random.randn(3,5),columns = [’one’,’two’,’three’,’four’,’five’])df2 = pd.DataFrame(np.random.randn(3,5),columns = [’one’,’two’,’three’,’four’,’five’])df3 = pd.DataFrame(np.random.randn(3,5),columns = [’one’,’two’,’three’,’four’,’five’])df4 = pd.DataFrame(np.random.randn(3,5),columns = [’one’,’two’,’three’,’four’,’five’])df1.plot(ax = ax1, title = 'df1', grid = ’on’)df2.plot(ax = ax2, title = 'df1', grid = ’on’)df3.plot(ax = ax3, title = 'df1', grid = ’on’)df4.plot(ax = ax4, title = 'df1', grid = ’on’)plt.show()
運行結(jié)果如下

可以看出,隨機生成了幾個dataframe,在一個figure()中生成了四個子圖,每個子圖的圖例都是dataframe.columns里的值,那么如何移除這些圖例?
import pandas as pdimport numpy as npimport matplotlib.pyplot as pltfig = plt.figure(1)ax1 = fig.add_subplot(2,2,1)ax2 = fig.add_subplot(2,2,2)ax3 = fig.add_subplot(2,2,3)ax4 = fig.add_subplot(2,2,4)df1 = pd.DataFrame(np.random.randn(3,5),columns = [’one’,’two’,’three’,’four’,’five’])df2 = pd.DataFrame(np.random.randn(3,5),columns = [’one’,’two’,’three’,’four’,’five’])df3 = pd.DataFrame(np.random.randn(3,5),columns = [’one’,’two’,’three’,’four’,’five’])df4 = pd.DataFrame(np.random.randn(3,5),columns = [’one’,’two’,’three’,’four’,’five’])df1.plot(ax = ax1, title = 'df1', grid = ’on’)df2.plot(ax = ax2, title = 'df1', grid = ’on’)df3.plot(ax = ax3, title = 'df1', grid = ’on’)df4.plot(ax = ax4, title = 'df1', grid = ’on’)ax1.legend_.remove() ##移除子圖ax1中的圖例ax2.legend_.remove() ##移除子圖ax2中的圖例ax3.legend_.remove() ##移除子圖ax3中的圖例plt.show()

可以看出ax1,ax2,ax3中的圖例都被移除了,但是上圖還不是很美觀?有沒有什么辦法將圖例放到圖外面呢?請看:
import pandas as pdimport numpy as npimport matplotlib.pyplot as pltfig = plt.figure(1)ax1 = fig.add_subplot(2,2,1)ax2 = fig.add_subplot(2,2,2)ax3 = fig.add_subplot(2,2,3)ax4 = fig.add_subplot(2,2,4)df1 = pd.DataFrame(np.random.randn(3,5),columns = [’one’,’two’,’three’,’four’,’five’])df2 = pd.DataFrame(np.random.randn(3,5),columns = [’one’,’two’,’three’,’four’,’five’])df3 = pd.DataFrame(np.random.randn(3,5),columns = [’one’,’two’,’three’,’four’,’five’])df4 = pd.DataFrame(np.random.randn(3,5),columns = [’one’,’two’,’three’,’four’,’five’])df1.plot(ax = ax1, title = 'df1', grid = ’on’)df2.plot(ax = ax2, title = 'df1', grid = ’on’)df3.plot(ax = ax3, title = 'df1', grid = ’on’)df4.plot(ax = ax4, title = 'df1', grid = ’on’)ax1.legend_.remove()ax2.legend_.remove()ax3.legend_.remove()ax4.legend(loc=2, bbox_to_anchor=(1.05,1.0),borderaxespad = 0.) ##設(shè)置ax4中l(wèi)egend的位置,將其放在圖外plt.show()
其中參數(shù)loc用于設(shè)置legend的位置
bbox_to_anchor用于在bbox_transform坐標(biāo)(默認軸坐標(biāo))中為圖例指定任意位置。
以上這篇python matplotlib實現(xiàn)將圖例放在圖外就是小編分享給大家的全部內(nèi)容了,希望能給大家一個參考,也希望大家多多支持好吧啦網(wǎng)。
相關(guān)文章:
1. Python TestSuite生成測試報告過程解析2. python讓函數(shù)不返回結(jié)果的方法3. python之cur.fetchall與cur.fetchone提取數(shù)據(jù)并統(tǒng)計處理操作4. JSP之表單提交get和post的區(qū)別詳解及實例5. python實現(xiàn)讀取類別頻數(shù)數(shù)據(jù)畫水平條形圖案例6. PHP循環(huán)與分支知識點梳理7. 解決AJAX返回狀態(tài)200沒有調(diào)用success的問題8. chat.asp聊天程序的編寫方法9. 低版本IE正常運行HTML5+CSS3網(wǎng)站的3種解決方案10. jsp實現(xiàn)登錄驗證的過濾器

 網(wǎng)公網(wǎng)安備