如何基于Python爬取隱秘的角落評論
“一起去爬山吧?”
這句臺詞火爆了整個朋友圈,沒錯,就是來自最近熱門的《隱秘的角落》,豆瓣評分8.9分,好評不斷。

感覺還是蠻不錯的。同時,為了想更進一步了解一下小伙伴觀劇的情況,永恒君抓取了愛奇藝平臺評論數據并進行了分析。下面來做個分享,給大伙參考參考。
1、爬取評論數據
因為該劇是在愛奇藝平臺獨播的,自然數據源從這里取比較合適。永恒君爬取了《隱秘的角落》12集的從開播日6月16日-6月26日的評論數據。
使用 Chrome 查看源代碼模式,在播放頁面往下面滑動,有一個 get_comments 的請求,經過調試分析,這個接口就是獲取評論數據的接口,后面連接上一系列的參數即可獲取評論的數據。
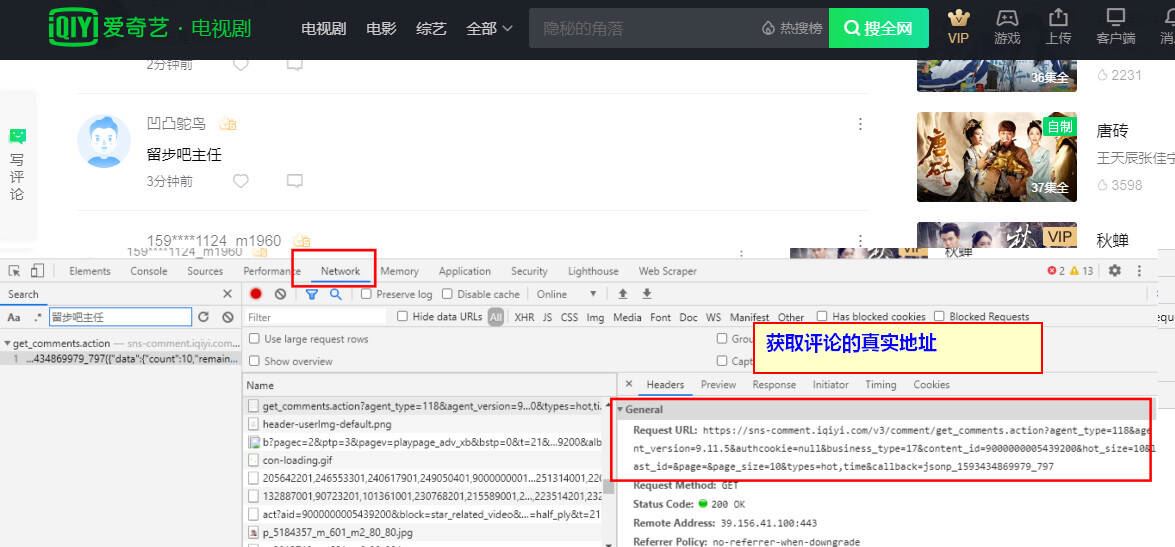
其中關鍵的就是last_id這個參數,是用來控制評論分頁的,需要通過上一個頁面最后一條評論的id來進行獲取。
爬蟲部分代碼
def get_comment_html(movieId, movieName, lastId):#將獲取評論的json源碼,保存到txt文件中 url = 'http://sns-comment.iqiyi.com/v3/comment/get_comments.action?' params = { 'types':'time', 'business_type':'17', 'agent_type':'118', 'agent_version':'9.11.5', 'authcookie':'authcookie' } for item in params: url = url + item + '=' + params[item] + '&' url = url + 'content_id=' + movieId+ '&last_id=' + lastId #url 為拼接好的評論地址 headers = { 'User-Agent': 'Mozilla/5.0 (Windows NT 10.0; Win64; x64) AppleWebKit/537.36 (KHTML, like Gecko) Chrome/83.0.4103.116 Safari/537.36', 'Accept': 'application/json, text/javascript', 'Referer': 'https://www.iqiyi.com/v_19rxtiliso.html?vfm=2008_aldbd&fv=p_02_01', } response = requests.get(url, headers=headers) filename = movieId + movieName+'.txt' if response.status_code == 200:with open(filename,'a',encoding=’utf-8’) as f: f.write(response.text+'n') #將獲取的評論json源碼保存到txt文件,一次寫入一行,表示獲取的這一頁的評論else: print('request error') print('爬取第{}頁評論'.format(file_lines(filename))) time.sleep(0.5) last_id = parseData(response.text) #解析并獲取下一個id if last_id != 'End': get_comment_html(movieId, movieName, parseData(response.text)) else: print('已到結尾') #continue#結束整個程序 return None
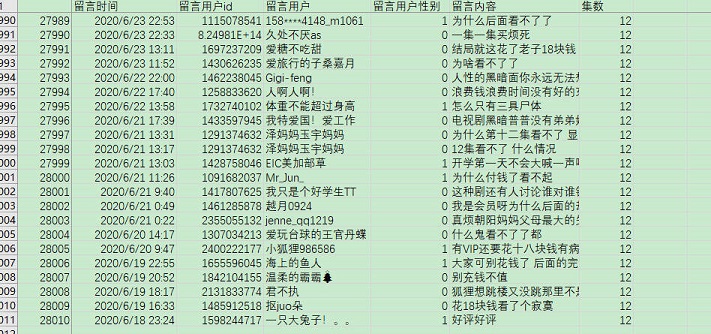
最終將12集爬取下來的包含評論數據的json源碼保存到txt文件當中,解析提取評論的時間、用戶名、性別、評論內容等信息,經過去重、去空白等數據清理工作,最終獲得28010條評論信息。
2、分析展示數據
在海量的數據中,我們可以分析出我們想看到的結果。為了更好的數據處理和可視化展示,這里永恒君用了Pandas和Pyecharts 這兩個庫。
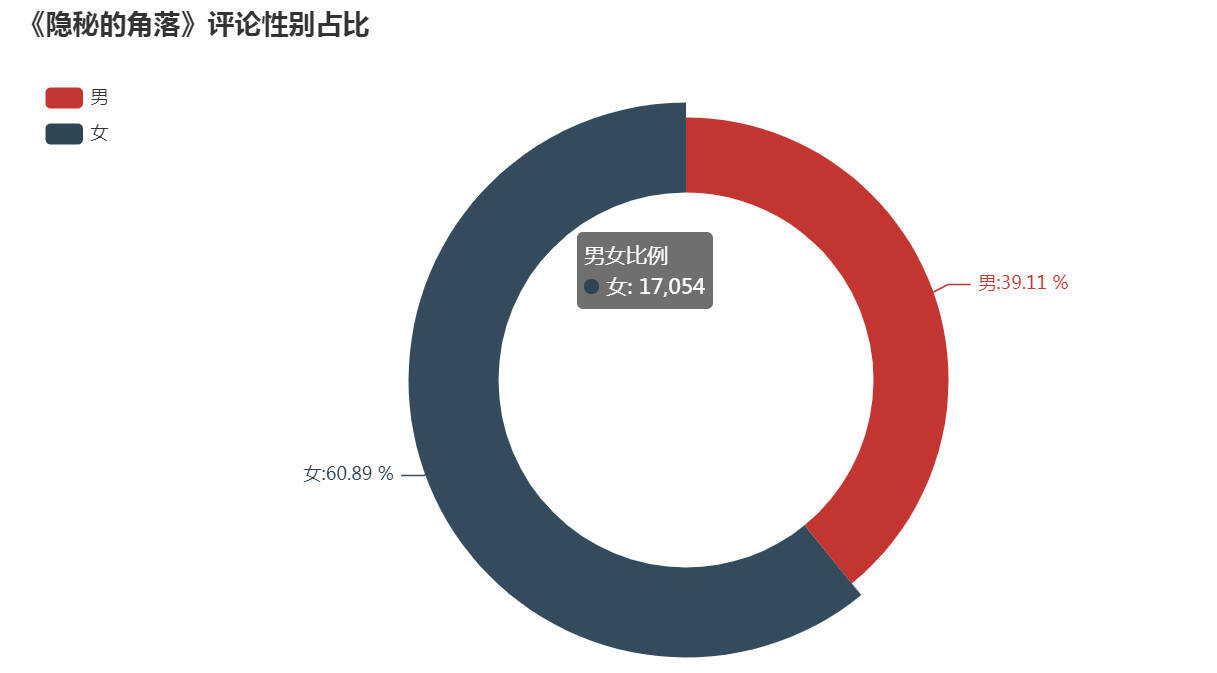
1)評論用戶性別方面
女生占了大部分,占比60.89%,比男性用戶要多不少。
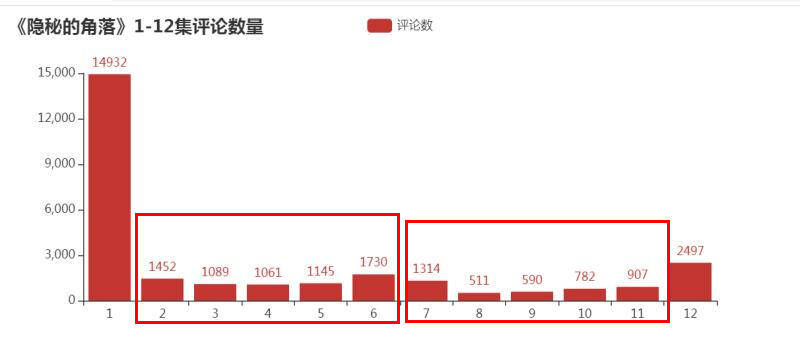
2)每一集的評論數量
接下來,我們再來看一下,每一期的評論數量,看是否能夠得出一些不一樣的數據。
from pyecharts.charts import Bar ##導入需要使用的圖表from pyecharts import options as opts ##導入配置項comment_num3 = df['集數'].value_counts().sort_index()x_line3 = comment_num3.index.to_list()y_line3 = comment_num3.values.tolist()bar1=( Bar(init_opts=opts.InitOpts(width=’800px’, height=’350px’)) ##定義為柱狀圖 .add_xaxis(x_line3) ##X軸的值 .add_yaxis(’評論數’,y_line3) ##y的值和y的一些數據配置項 .set_global_opts(title_opts=opts.TitleOpts(title=’《隱秘的角落》1-12集評論數量’)) ) bar1.render('bar3.html') ###輸出html文件
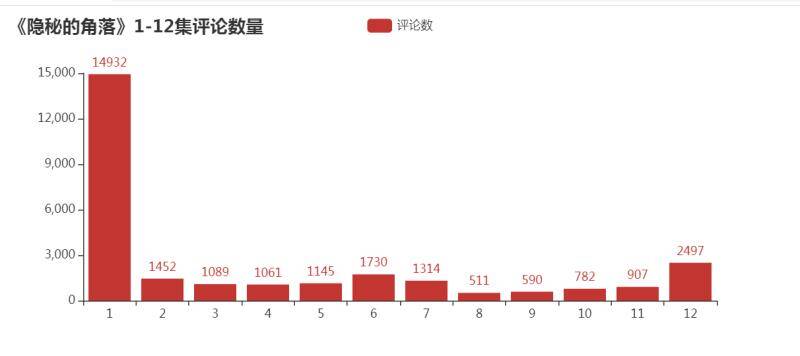
除了第一集的評論數特別多之外,可以看到,上半段的評論數明顯要比下半段的要多,是否意味著大家普遍覺得前期的要更好看一些?
3)開播十天之內的評論數量走勢
接下來我們來看看從6月16日開播之后,網友們對該劇的評論數量走勢情況。
from pyecharts.charts import Line ##導入需要使用的圖表from pyecharts import options as opts ##導入配置項comment_num = df['留言時間'].str.split(’ ’).str[0].value_counts().sort_index()x_line1 = [i.replace(’2020-’,’’) for i in comment_num.index.to_list()] y_line1 = comment_num.values.tolist()# 繪制面積圖line1 = Line(init_opts=opts.InitOpts(width=’1200px’, height=’600px’))line1.add_xaxis(x_line1)line1.add_yaxis(’’, y_line1,markpoint_opts=opts.MarkPointOpts(data=[ opts.MarkPointItem(type_=’max’, name=’最大值’), opts.MarkPointItem(type_=’min’, name=’最小值’)])) line1.set_global_opts(title_opts=opts.TitleOpts(’《隱秘的角落》開播10天內評論走勢’), xaxis_opts=opts.AxisOpts(axislabel_opts=opts.LabelOpts(rotate=’30’)), #visualmap_opts=opts.VisualMapOpts(max_=12673) ) line1.set_series_opts(label_opts=opts.LabelOpts(is_show=True), linestyle_opts=opts.LineStyleOpts(width=2))line1.render('Line.html')
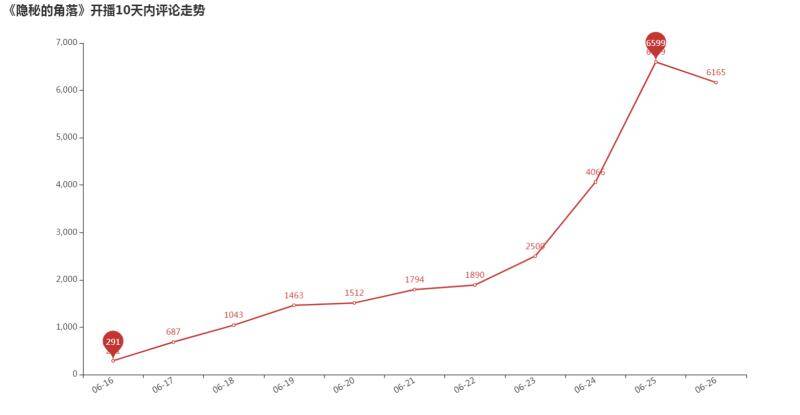
可以看到,從6月16日開播后,評論數量一路走高在6月25日達到了一個階段的高點。
4)一天之中大家都在什么時間段看這部劇?
通過統計16日-26日每日0-23時的評論數量,來看看大家一般都在什么時候看劇
from pyecharts.charts import Bar ##導入需要使用的圖表from pyecharts import options as opts ##導入配置項comment_num2 = df['留言時間'].str.split(’ ’).str[1].str.split(':').str[0].value_counts().sort_index()x_line2 = comment_num2.index.to_list()y_line2 = comment_num2.values.tolist()bar1=( Bar(init_opts=opts.InitOpts(width=’800px’, height=’350px’)) ##定義為柱狀圖 .add_xaxis(x_line2) ##X軸的值 .add_yaxis(’評論數’,y_line2) ##y的值和y的一些數據配置項 .set_global_opts(title_opts=opts.TitleOpts(title=’《隱秘的角落》0-23時評論數量’)) ) bar1.render('bar2.html') ###輸出html文件

可以看到,晚上20點-23時為最集中看劇的時間段,其次中午12-14點也有一波小高峰,總體更多的人是下午看劇的人多。
這是否也是你看劇的時間段呢?
5)評論的字數情況
永恒君一般看劇基本都不寫評論的或者也是簡單幾個字,但是在這里,我特地看了一下評論字數的分布,
def comment_word_group(strings): #評論字數分組函數 if len(strings)<=10: length = 0 elif len(strings) > 10 and len(strings)<=30: length = 1 elif len(strings) >30 and len(strings) <=50: length = 2 else: length = 3 return lengthdf['留言數量組別'] = df['留言內容'].apply(lambda x:comment_word_group(x))#評論字數分組lengthData = df.groupby([’留言數量組別’])['留言內容'].count()#評論字數分組統計from pyecharts.charts import Bar ##導入需要使用的圖表from pyecharts import options as opts ##導入配置項attr = ['10字以內','10~30字','30~50字','50字以上'] #X軸v1 = lengthData.values.tolist() #Y軸bar1=( Bar(init_opts=opts.InitOpts(width=’800px’, height=’350px’)) ##定義為柱狀圖 .add_xaxis(attr) ##X軸的值 .add_yaxis(’評論數量’,v1) ##y的值和y的一些數據配置項 .set_global_opts(title_opts=opts.TitleOpts(title=’《隱秘的角落》評論字數分布’)) ) bar1.render('bar.html') ###輸出html文件
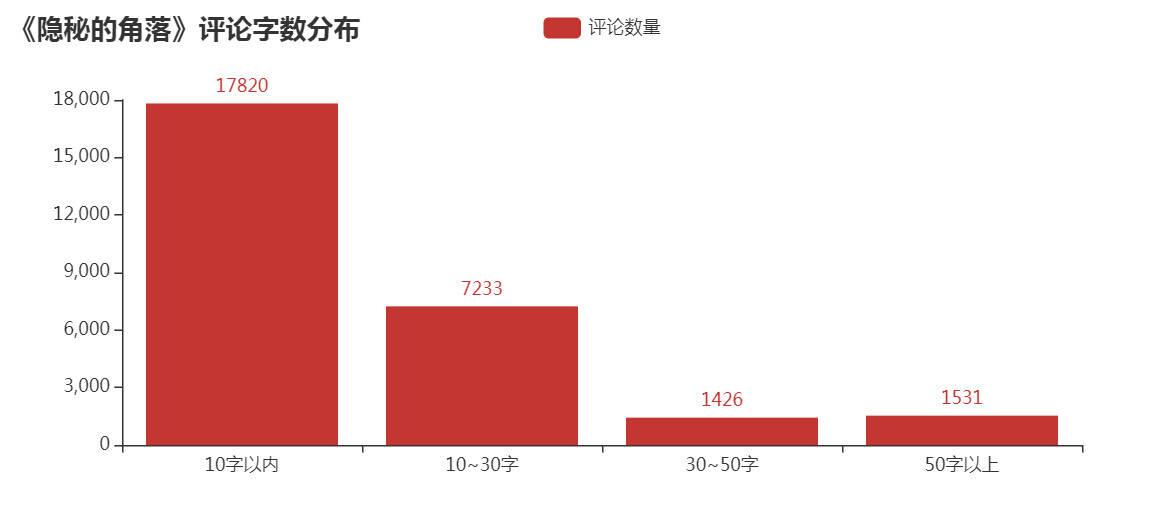
絕大部分的評論字數都是在10個字以內,但也有約25%的評論字數在10-30個之內,還是讓永恒君有點意外,是否說明該劇火爆也是有原因的,激起了不少伙伴的共鳴。
6)評論核心關鍵詞
最后,永恒君將通過wordcloud庫制作詞云來看看,大家對該劇的整體評價,以及該劇的核心關鍵詞。
#詞云from PIL import Imagefrom wordcloud import WordCloud,ImageColorGenerator,STOPWORDSimport jiebaimport matplotlib.pyplot as pltimport numpy as npcontents = df['留言內容'].str.cat(sep=' ')contentssw = set(STOPWORDS)sw.add('這個')sw.add('什么')cut_text2 = ' '.join(jieba.lcut(contents))background_image = np.array(Image.open('bg.png'))wc = WordCloud(font_path=r’C:WindowsFontssimhei.ttf’,background_color=’White’,max_words=3000,width=1000,height=500,scale=1,stopwords=sw,#停用詞mask = background_image)#font_path:設置字體,max_words:出現的最多詞數量,mask參數=圖片背景,必須要寫上,另外有mask參數再設定寬高是無效的wc.generate(cut_text2)wc.to_file('a2.jpg')#將圖繪制出來plt.imshow(wc)plt.axis('off') plt.show()

可以看到,“朝陽”、“嚴良”、“張東升”、“普普”、“好看”、“喜歡”、“小孩”、“原著”等關鍵詞都是大伙在熱議的。
不得不說,近年來如此火熱的、而且質量不錯的國產劇確實不多了。永恒君看前幾集的時候,突然又有大學時候看《越獄》的那個味道,看了一集就想看下一集,停不下來。
如果你現在還沒有來得及看,建議抽個時間去看看吧~~~
以上就是本文的全部內容,希望對大家的學習有所幫助,也希望大家多多支持好吧啦網。
相關文章:
 網公網安備
網公網安備